On Digital Learning, you benefit from two distinct dashboards: one dedicated to your online learning platform and one specific to your marketplace.
On the dashboard of your online learning platform, you have a detailed overview of:
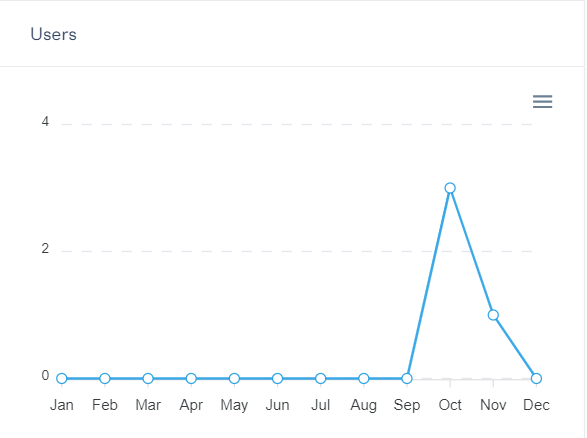
– The number of users you have added each month.
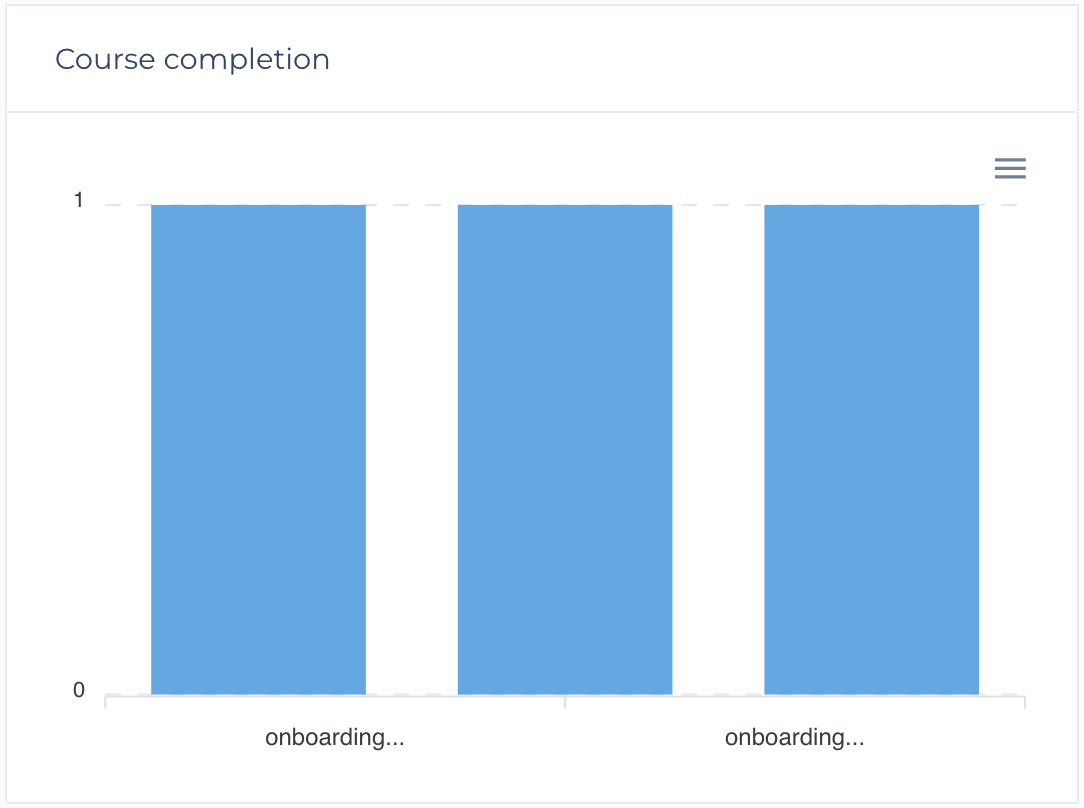
– The progress of your learners across all your courses, representing the total number of enrolled learners.
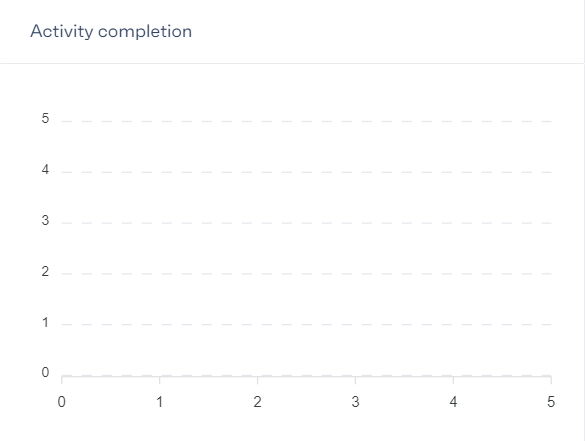
– Activity completion, reflecting the progress of your learners within your courses.
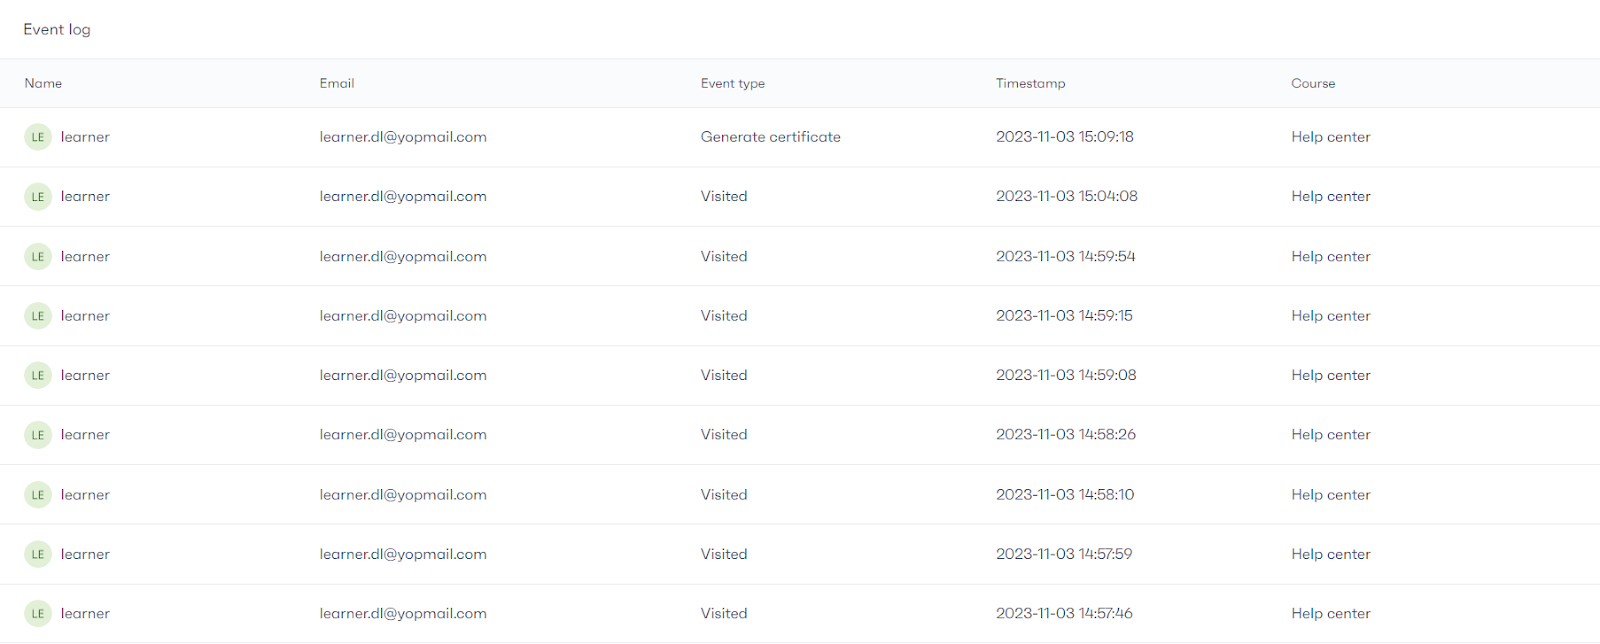
– Detailed tracking of actions taken by your participants, such as visits, course completions, quiz participation, with a detailed timeline by date and time.
As for the dashboard of your marketplace, it provides visibility on:
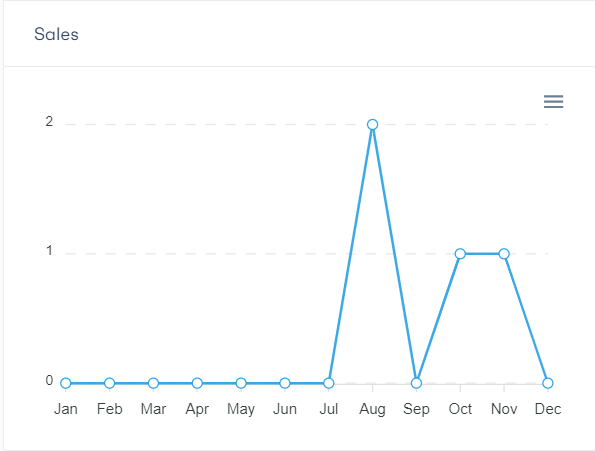
– Your sales, indicating the number of transactions made each month.
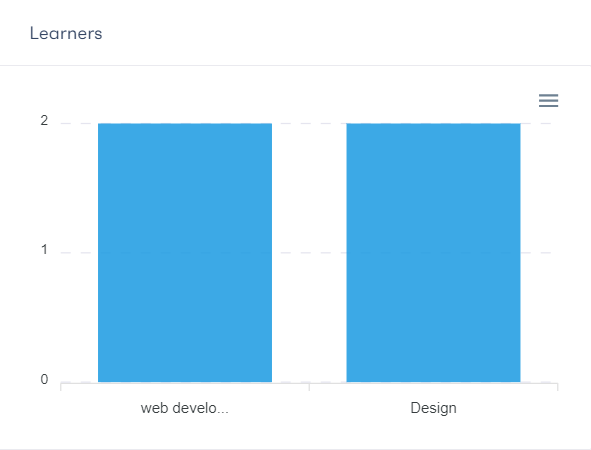
– The number of learners enrolled per course, allowing you to understand the popularity of each program.
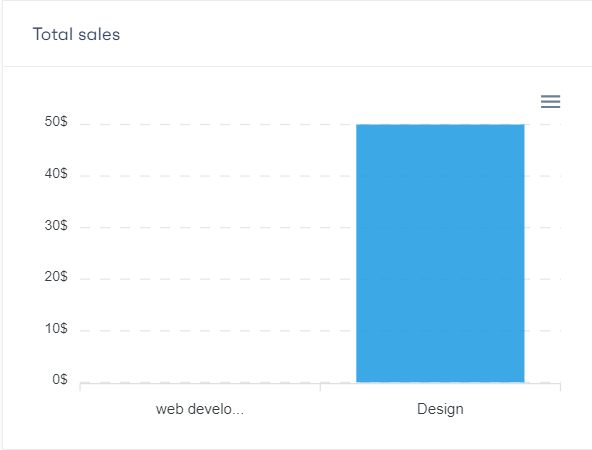
– The total sales generated by each course, providing a clear perspective on the financial performance of each module.